Introduction
The oracle alert.log and listener.log contain useful information to provide answer to questions like:
- When did the Instance start?
- When has the Instance been shutdown?
- When did ORA- occur? With which code?
- Which IP client did connect to the Instance? With which user?
- How did it connect? Through a service? Through the SID?
- Which program has been used to connect?
- A connection storm occurred, what is the source of it?
What about having all this information centralized? What about having the possibility to gather, format, search, analyze and visualize this information in real time?
To achieve this, let’s use the ELK stack:
- Logstash to collect the information the way we want to.
- Elasticsearch as an analytics engine.
- Kibana to visualize the data.
Installation
The installation is very simple.
- Install elasticsearch
[root@elk ~]# wget https://download.elasticsearch.org/elasticsearch/release/org/elasticsearch/distribution/rpm/elasticsearch/2.2.1/elasticsearch-2.2.1.rpm
[root@elk ~]# yum localinstall elasticsearch-2.2.1.rpm
- Edit the configuration file to mention on which host it has been installed (namely elk in my case):
[root@elk ~]# grep network.host /etc/elasticsearch/elasticsearch.yml
network.host: elk
- Start elasticsearch:
[root@elk ~]# /etc/init.d/elasticsearch start
Starting elasticsearch: [ OK ]
- Install Kibana:
[root@elk ~]# wget https://download.elastic.co/kibana/kibana/kibana-4.4.2-linux-x64.tar.gz
[root@elk ~]# tar -xf kibana-4.4.2-linux-x64.tar.gz --directory /opt
[root@elk ~]# mv /opt/kibana-4.4.2-linux-x64 /opt/kibana
- Edit the configuration file so that the url is updated accordingly:
[root@elk ~]# grep elasticsearch.url /opt/kibana/config/kibana.yml
elasticsearch.url: "http://elk:9200"
- Start Kibana:
[root@elk ~]# /opt/kibana/bin/kibana
- Install logstash on the oracle host (namely dprima in my case):
[root@dprima ~]# wget https://download.elastic.co/logstash/logstash/packages/centos/logstash-2.2.2-1.noarch.rpm
[root@dprima ~]# yum localinstall logstash-2.2.2-1.noarch.rpm
Configure logstash to push and format the alert.log to elasticsearch the way we want to
So that:
- The @timestamp field is reflecting the timestamp at which the log entry was created (rather than when logstash read the log entry).
- It traps ORA- entries and creates a field ORA- when it occurs.
- It traps the start of the Instance (and fill a field oradb_status accordingly).
- It traps the shutdown of the Instance (and fill a field oradb_status accordingly).
- It traps the fact that the Instance is running (and fill a field oradb_status accordingly).
New fields are being created so that we can analyze/visualize them later on with Kibana.
- To trap and format this information, let’s create an alert_log.conf configuration file that looks like (the filter part contains the important stuff):
input {
  file {
      path => "/u01/app/oracle/diag/rdbms/pbdt/PBDT/trace/alert_PBDT.log"
  }
}

filter {

# Join lines based on the time
  multiline {
    pattern => "%{DAY} %{MONTH} %{MONTHDAY} %{TIME} %{YEAR}"
    negate => true
    what => "previous"
  }

# Create new field: oradb_status: starting,running,shutdown
 if [message] =~ /Starting ORACLE instance/ {
    mutate {
        add_field => [ "oradb_status", "starting" ]
    }
 } else if [message] =~ /Instance shutdown complete/ {
    mutate {
        add_field => [ "oradb_status", "shutdown" ]
    }
 } else {
      mutate {
        add_field => [ "oradb_status", "running" ]
    }
 }

# Search for ORA- and create field if match

if [message] =~ /ORA-/ {
 grok {
   match => [ "message","(?<ORA->ORA-[0-9]*)" ]
 }
}

# Extract the date and the rest from the message
  grok {
    match => [ "message","%{DAY:day} %{MONTH:month} %{MONTHDAY:monthday} %{TIME:time} %{YEAR:year}(?<log_message>.*$)" ]
  }

  mutate {
       add_field => {
        "timestamp" => "%{year} %{month} %{monthday} %{time}"
       }
  }
# replace the timestamp by the one coming from the alert.log
  date {
      locale => "en"
      match => [ "timestamp" , "yyyy MMM dd HH:mm:ss" ]
  }

# replace the message (remove the date)
  mutate { replace => [ "message", "%{log_message}" ]  }

  mutate {
      remove_field => [ "time" ,"month","monthday","year","timestamp","day","log_message"]
  }

}

output {
elasticsearch {
hosts => ["elk:9200"]
index => "oracle-%{+YYYY.MM.dd}"
}
}
- Start logstash with this configuration file:
[root@dprima ~]# /opt/logstash/bin/logstash -f /etc/logstash/conf.d/alert_log.conf
- So that for example an entry in the alert.log file like:
Sat Mar 26 08:30:26 2016
ORA-1653: unable to extend table SYS.BDT by 8 in                 tablespace BDT
will be formatted and send to elasticsearch that way:
{
         "message" => "\nORA-1653: unable to extend table SYS.BDT by 8 in                 tablespace BDT ",
        "@version" => "1",
      "@timestamp" => "2016-03-26T08:30:26.000Z",
            "path" => "/u01/app/oracle/diag/rdbms/pbdt/PBDT/trace/alert_PBDT.log",
            "host" => "Dprima",
            "tags" => [
        [0] "multiline"
    ],
    "oradb_status" => "running",
            "ORA-" => "ORA-1653"
}
Configure logstash to push and format the listener.log to elasticsearch the way we want to
So that:
- The @timestamp field is reflecting the timestamp at which the log entry was created (rather than when logstash read the log entry).
- It traps the connections and records the program into a dedicated field program.
- It traps the connections and records the user into a dedicated field user.
- It traps the connections and records the ip of the client into a dedicated field ip_client.
- It traps the connections and records the destination into a dedicated field dest.
- It traps the connections and records the destination type (SID or service_name) into a dedicated field dest_type.
- It traps the command (stop, status, reload) and records it into a dedicated field command.
New fields are being created so that we can analyze/visualize them later on with Kibana.
- To trap and format this information, let’s create a lsnr_log.conf configuration file that looks like (the filter part contains the important stuff):
input {
 file {
   path => "/u01/app/oracle/diag/tnslsnr/Dprima/listener/trace/listener.log"
  }
}

filter {

 if [message] =~ /(?i)CONNECT_DATA/ {

  # Extract the date and the rest from the message
  grok {
    match => [ "message","(?<the_date>.*%{TIME})(?<lsnr_message>.*$)" ]
  }

  # Extract COMMAND (like status,reload,stop) and add a field
  if [message] =~ /(?i)COMMAND=/ {

   grok {
   match => [ "lsnr_message","^.*(?i)COMMAND=(?<command>.*?)\).*$" ]
   }

  } else {

  # Extract useful Info (USER,PROGRAM,IPCLIENT) and add fields
   grok {
   match => [ "lsnr_message","^.*PROGRAM=(?<program>.*?)\).*USER=(?<user>.*?)\).*ADDRESS.*HOST=(?<ip_client>%{IP}).*$" ]
   }
  }

  # replace the timestamp by the one coming from the listener.log
  date {
      locale => "en"
      match => [ "the_date" , "dd-MMM-yyyy HH:mm:ss" ]
  }

  # replace the message (remove the date)
  mutate { replace => [ "message", "%{lsnr_message}" ]  }

  # remove temporary fields
  mutate { remove_field => [ "the_date","lsnr_message"] }

  # search for SID or SERVICE_NAME, collect dest and add dest type
  if [message] =~ /(?i)SID=/ {
  grok { match => [ "message","^.*(?i)SID=(?<dest>.*?)\).*$" ] }
  mutate { add_field => [ "dest_type", "SID" ] }
  }

  if [message] =~ /(?i)SERVICE_NAME=/ {
  grok { match => [ "message","^.*(?i)SERVICE_NAME=(?<dest>.*?)\).*$" ] }
  mutate { add_field => [ "dest_type", "SERVICE" ] }
  }

  } else {
   drop {}
  }
}

output {
elasticsearch {
hosts => ["elk:9200"]
index => "oracle-%{+YYYY.MM.dd}"
}
}
- Start logstash with this configuration file:
[root@Dprima conf.d]# /opt/logstash/bin/logstash -f /etc/logstash/conf.d/lsnr_log.conf
- So that for example an entry in the listener.log file like:
26-MAR-2016 08:34:57 * (CONNECT_DATA=(SID=PBDT)(CID=(PROGRAM=SQL Developer)(HOST=__jdbc__)(USER=bdt))) * (ADDRESS=(PROTOCOL=tcp)(HOST=192.168.56.1)(PORT=50379)) * establish * PBDT * 0
will be formatted and send to elasticsearch that way:
{
       "message" => " * (CONNECT_DATA=(SID=PBDT)(CID=(PROGRAM=SQL Developer)(HOST=__jdbc__)(USER=bdt))) * (ADDRESS=(PROTOCOL=tcp)(HOST=192.168.56.1)(PORT=50380)) * establish * PBDT * 0",
      "@version" => "1",
    "@timestamp" => "2016-03-26T08:34:57.000Z",
          "path" => "/u01/app/oracle/diag/tnslsnr/Dprima/listener/trace/listener.log",
          "host" => "Dprima",
       "program" => "SQL Developer",
          "user" => "bdt",
     "ip_client" => "192.168.56.1",
          "dest" => "PBDT",
     "dest_type" => "SID"
}
Analyze and Visualize the data with Kibana
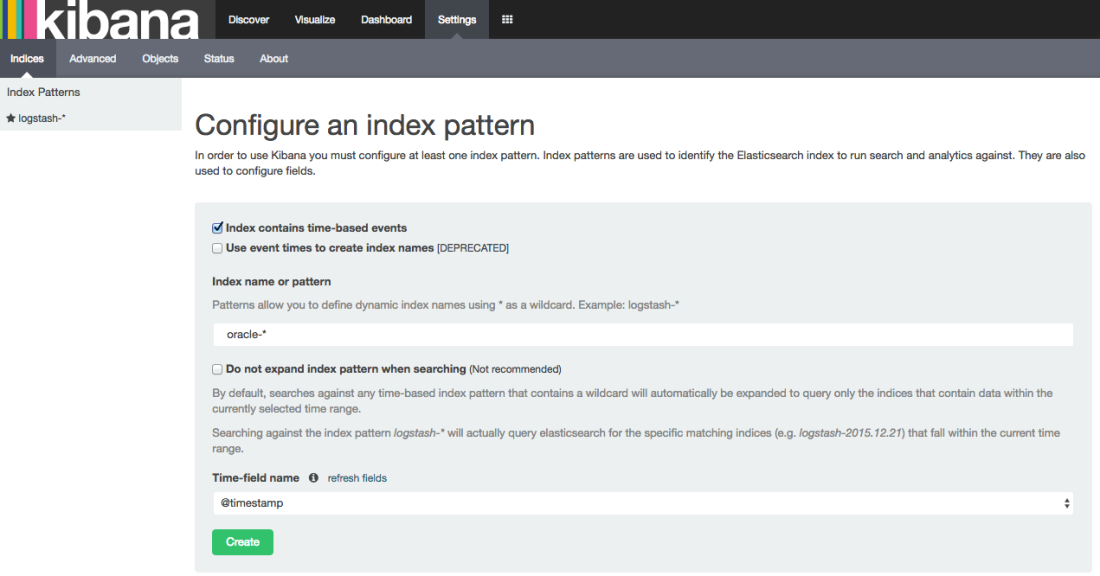
- Connect to the elk host, (http://elk:5601) and create an index pattern (Pic 1):
- Check that all our custom fields have been indexed (this is the default behaviour) (Pic 2):

so that we can now visualize them.
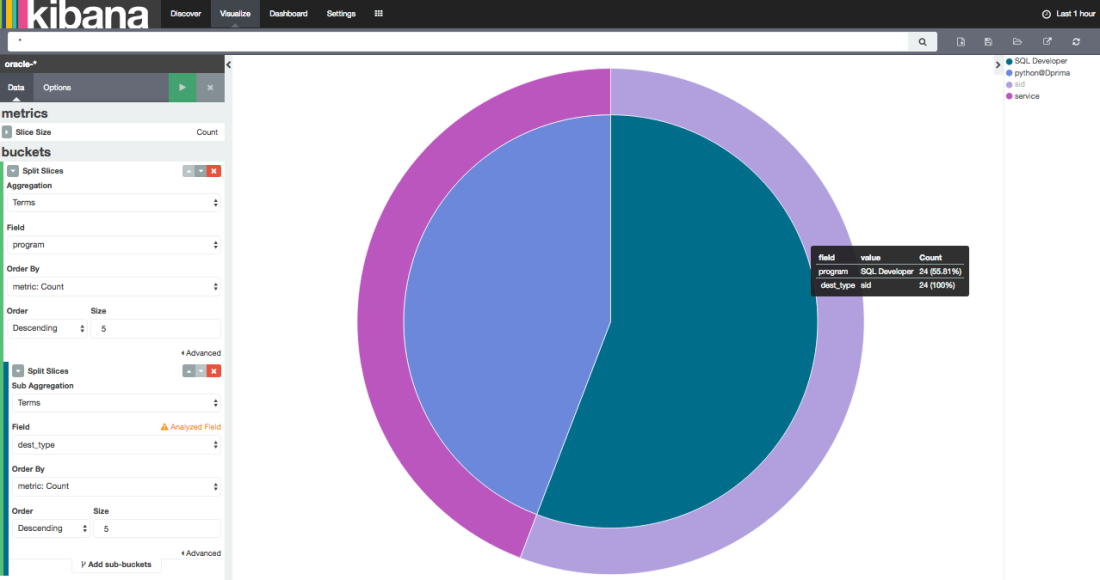
- Example 1: thanks to the listener.log data, let’s graph the connection repartition to our databases by program and by dest_type (Pic 3):
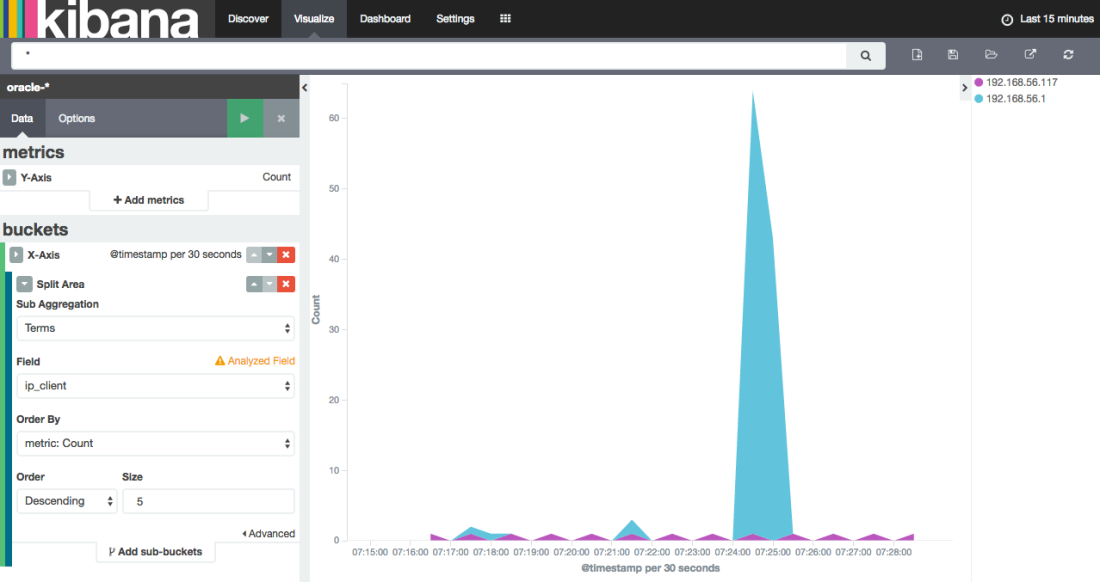
- Example 2: thanks to the listener.log data, visualize when a connection “storm” occurred and where it came from (ip_client field):
Remarks
- As you can see (into the Pic 2) the index on the program field has not been analyzed. By doing so, a connection to the database with “SQL Developer” will be stored in the index as “SQL Developer” and this is what we want. While an analyzed index would have stored 2 distincts values (“SQL” and “Developer”). The same apply for the ORA- field: ORA-1653 would store ORA and 1653 if analyzed (This is why it is specified as not analyzed as well). You can find more details here.
- To get the indexes on the program and ORA- fields not analyzed, a template has been created that way:
curl -XDELETE elk:9200/oracle*

curl -XPUT elk:9200/_template/oracle_template -d ' {
 "template" : "oracle*",
 "settings" : {
   "number_of_shards" : 1
   },
 "mappings" : {
  "oracle" : {
   "properties" : {
    "program" : {"type" : "string", "index": "not_analyzed" },
    "ORA-" : {"type" : "string", "index": "not_analyzed" }
    }
   }
  }
}'
- The configuration files are using grok. You can find more information about it here.
- You can find much more informations about the ELK stack (and another way to use it) into this blog post from Robin Moffatt
- All you need to do to visualize the data is to extract the fields of interest from the log files and be sure an index is created on each field you want to visualize.
- All this information coming from all the machines of a datacenter being centralized into a single place is a gold mine from my point of view.
Conclusion
Thanks to the ELK stack you can gather, centralize, analyze and visualize the content of the alert.log and listener.log files for your whole datacenter the way you want to. This information is a gold mine and the imagination is the only limit.

Reblogged this on Johnnyq72 and commented:
Very interesting work by Bertrand and very useful for gaining specific insights!
The date parsing doesn’t seem to be working for me. was getting grokparsefailures, so I commented out the drop of “the_date” and saw that it was coming through as:
{“message”: “18-APR-2016 09:29:08
instead of just grabbing the date/time stamp, so Logstash wasn’t able to properly use the “date” filter to replace TIMESTAMP.
Thoughts on that?
Hi Andrew,
did the issue occur during alert.log or listener.log filtering? (18-APR-2016 09:29:08 matchs the dd-MMM-yyyy HH:mm:ss format being used into the listener conf file).
Thx
Bertrand
Sorry. It was my error on the input filter. I was using a python script to push the file from a remote host and forgot that it sends the log line as JSON… 😉 Your parsing works great and my DBAs are thrilled to get their logs analyzed. Cheers!
Hi, I found this article excellent and timely as I just got started with LS and need to push the oracle listener logs to ES. Would you be able to explain how that pattern (# Extract useful Info (USER,PROGRAM,IPCLIENT) and add fields) works? That would be greatly appreciated as I am learning grok and regex. Also, what I found is that sometimes there is no program so it appears as PROGRAM= with nothing following it. When this happens I see a grok parse failure in ES. How could I trap that or change the pattern?
Thanks,
Frank
Hello, thanks for sharing this. I’ve followed the same steps using ELK 5.0 version, but not able to view data in visualization or discovery tab. can you please help
i am using below command to start logstash, is it fine?
/usr/share/logstash/bin/logstash “–path.settings” “/etc/logstash/conf.d” -f /etc/logstash/conf.d/lsnr_log.conf
Hello,
Try to send the output to stdout that way:
output {
stdout { codec => rubydebug }
}
to check what’s going on.
Thx
Bertrand
Hi,
I already have Logstash, ElasticSearch and Kibana on one server. Now I want to send the Oracle files to this remote server… which components should I install and how to proceed on the DB server?
Regards,
Hi,
I managed to do it just by installing and configuring logstash on DB server. However, the multiline filter is deprecated now, and although I tried to change it to the multiline codec, it didn’t work.
Have you tried doing it?
Regards,
Hi,
I did not try anything else that the content of this post.
Thx
Bertrand
Following error message is getting while parsing the DB alert log config file, please help me out on this and i am very new to this elasticsearch tools
version: logstash-6.4.2
=============ERROR=============
[2018-10-15T11:42:23,845][ERROR][logstash.plugins.registry] Tried to load a plugin’s code, but failed. {:exception=>#, :path=>”logstash/filters/multiline”, :type=>”filter”, :name=>”multiline”}
[2018-10-15T11:42:23,863][ERROR][logstash.agent ] Failed to execute action {:action=>LogStash::PipelineAction::Create/pipeline_id:main, :exception=>”LogStash::PluginLoadingError”, :message=>”Couldn’t find any filter plugin named ‘multiline’. Are you sure this is correct? Trying to load the multiline filter plugin resulted in this error: no such file to load — logstash/filters/multiline”, :backtrace=>[“D:/Hexa_Software/ELK/logstash-6.4.2/logstash-core/lib/logstash/plugins/registry.rb:211:in `lookup_pipeline_plugin'”, “D:/Hexa_Software/ELK/logstash-6.4.2/logstash-core/lib/logstash/plugin.rb:137:in `lookup'”, “org/logstash/plugins/PluginFactoryExt.java:210:in `plugin'”, “org/logstash/plugins/PluginFactoryExt.java:166:in `plugin'”, “D:/Hexa_Software/ELK/logstash-6.4.2/logstash-core/lib/logstash/pipeline.rb:71:in `plugin'”, “(eval):12:in `'”, “org/jruby/RubyKernel.java:994:in `eval'”, “D:/Hexa_Software/ELK/logstash-6.4.2/logstash-core/lib/logstash/pipeline.rb:49:in `initialize'”, “D:/Hexa_Software/ELK/logstash-6.4.2/logstash-core/lib/logstash/pipeline.rb:90:in `initialize'”, “D:/Hexa_Software/ELK/logstash-6.4.2/logstash-core/lib/logstash/pipeline_action/create.rb:38:in `execute'”, “D:/Hexa_Software/ELK/logstash-6.4.2/logstash-core/lib/logstash/agent.rb:309:in `block in converge_state'”]}
[2018-10-15T11:42:24,246][INFO ][logstash.agent ] Successfully started Logstash API endpoint {:port=>9600}
Looks like you need to install the multiline plugin
Thanks ….Issue resolved !!!!!
Hi bdrouvot,
Could you suggest me how to parse the oracle alert.log file.
From last two week I am struggling to parse the oracle log file.
Hi,
there is an example in this repo: https://github.com/bdrouvot/oracledb-logstash
Bertrand
I can’t create index
curl -XPUT localhost:9200/_template/oracle_template -H ‘content-type:application/json’ -d ‘ {
“template” : “oracle*”,
“settings” : {
“number_of_shards” : 1
},
“mappings” : {
“oracle” : {
“properties” : {
“program” : {“type” : “string”, “index”: “not_analyzed” },
“ORA-” : {“type” : “string”, “index”: “not_analyzed” }
}
}
}
}’
{“error”:{“root_cause”:[{“type”:”mapper_parsing_exception”,”reason”:”Root mapping definition has unsupported parameters: [oracle : {properties={ORA-={index=not_analyzed, type=string}, program={index=not_analyzed, type=string}}}]”}],”type”:”mapper_parsing_exception”,”reason”:”Failed to parse mapping [_doc]: Root mapping definition has unsupported parameters: [oracle : {properties={ORA-={index=not_analyzed, type=string}, program={index=not_analyzed, type=string}}}]”,”caused_by”:{“type”:”mapper_parsing_exception”,”reason”:”Root mapping definition has unsupported parameters: [oracle : {properties={ORA-={index=not_analyzed, type=string}, program={index=not_analyzed, type=string}}}]”}},”status”:400}